Built-in instrumentation
OutboxKit exposes logs, traces, and metrics out of the box, including integration with OpenTelemetry, making use of the excellent built-in support in .NET.
Below some of the logs, traces and metrics that are available out of the box are described, though keep in mind some more might be added, including by providers, in addition to the ones the core library provides.
Logs
There aren't a lot of logs going on, but there are a few. The majority of them are at the Debug level, mostly to help with debugging and troubleshooting. Some examples are when the polling background service is starting, waking up to poll, and when it's shutting down.
Other than the Debug logs, there are also a couple of Error logs, when some unexpected exception happens. OutboxKit doesn't stop working while the application is running, so it will log the exception and then try to continue working - in the context of a polling provider, this basically means it will sleep for a while and then try again later.
Traces
For some operations, OutboxKit will start activities (corresponding to spans), which will be recorded as part of traces.
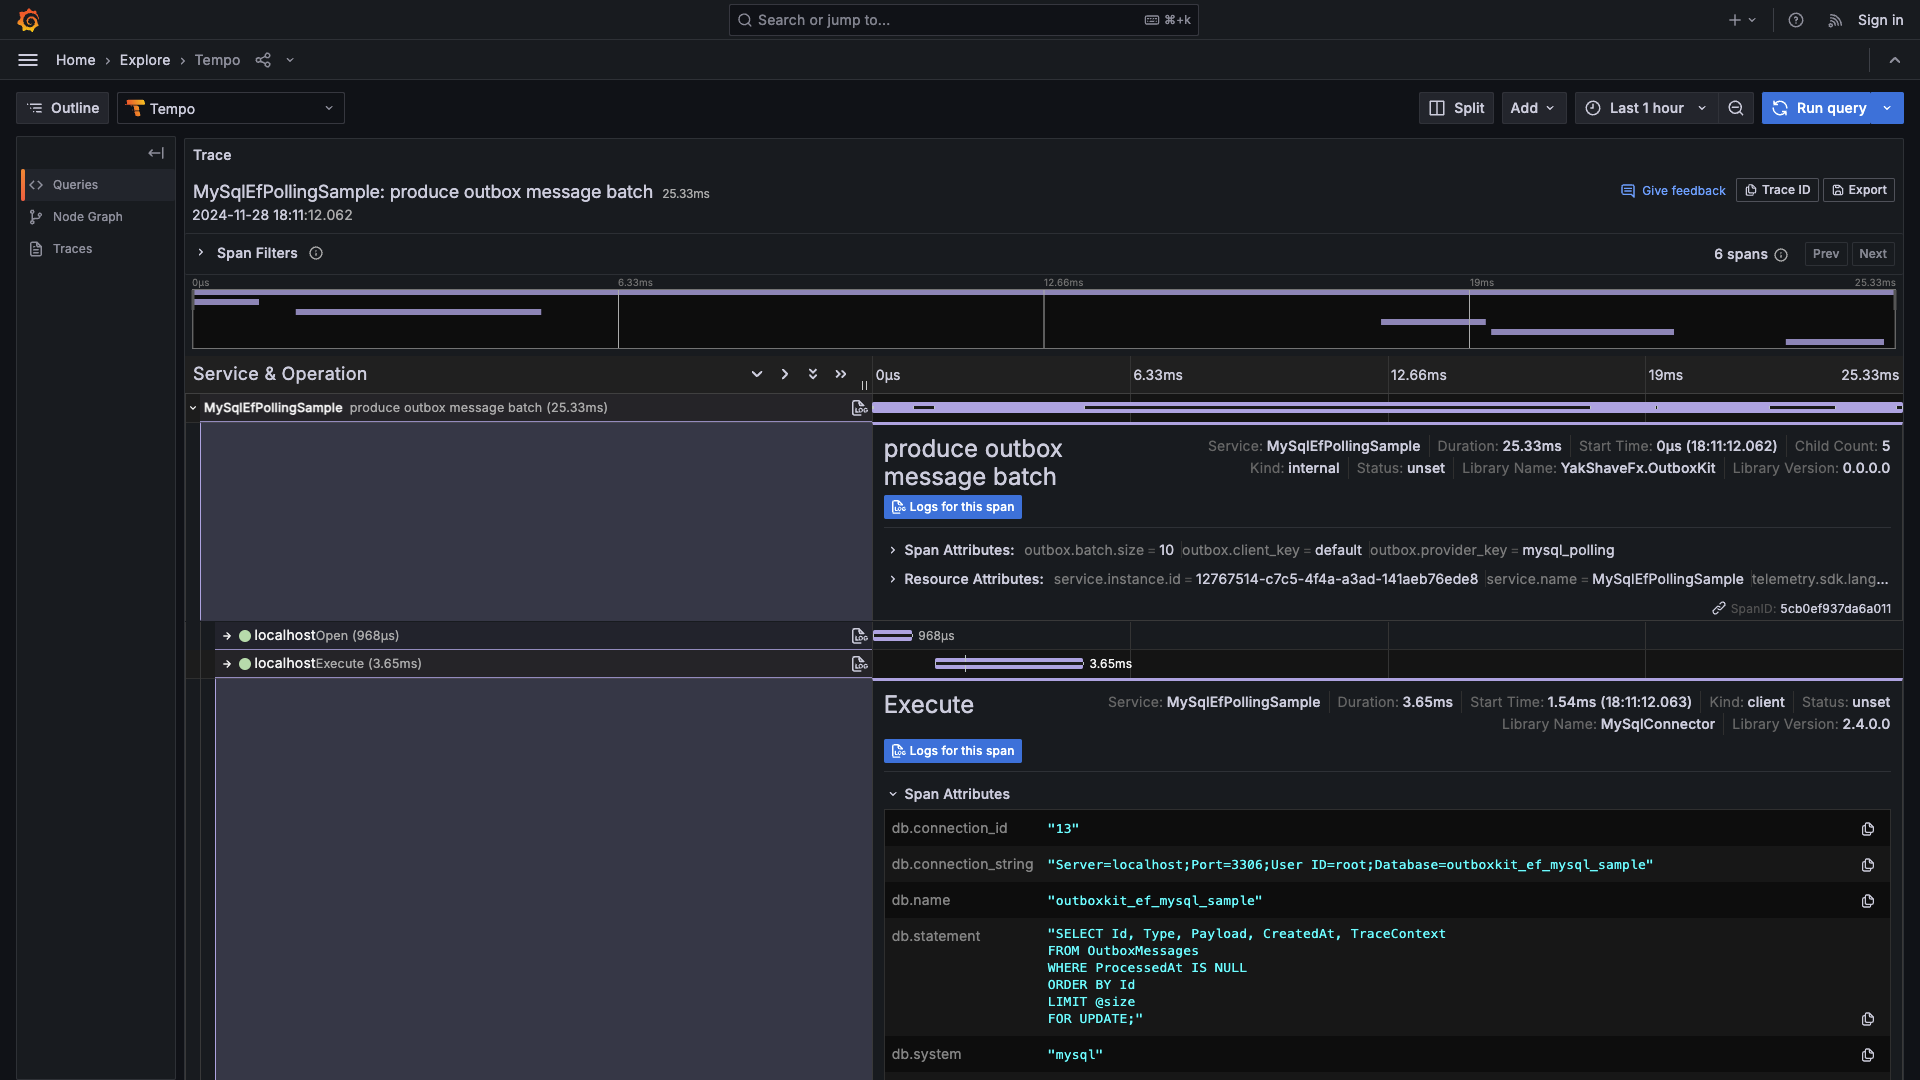
At the time of writing, activities are started when producing a batch of messages, as well as when cleaning up processed messages.
Some tags are added to the activities, like outbox key information, among other things.
Here's an example trace, when producing a batch of messages, which includes the span created by OutboxKit, as well as some created by MySqlConnector.
Metrics
Finally, OutboxKit also exposes some metrics.
Metrics exposed include:
- number of batches produced
- number of messages produced
- number of processed messages cleaned
- polling cycles and their results
- produced messages pending completion, the amount of retry attempts and messages retried
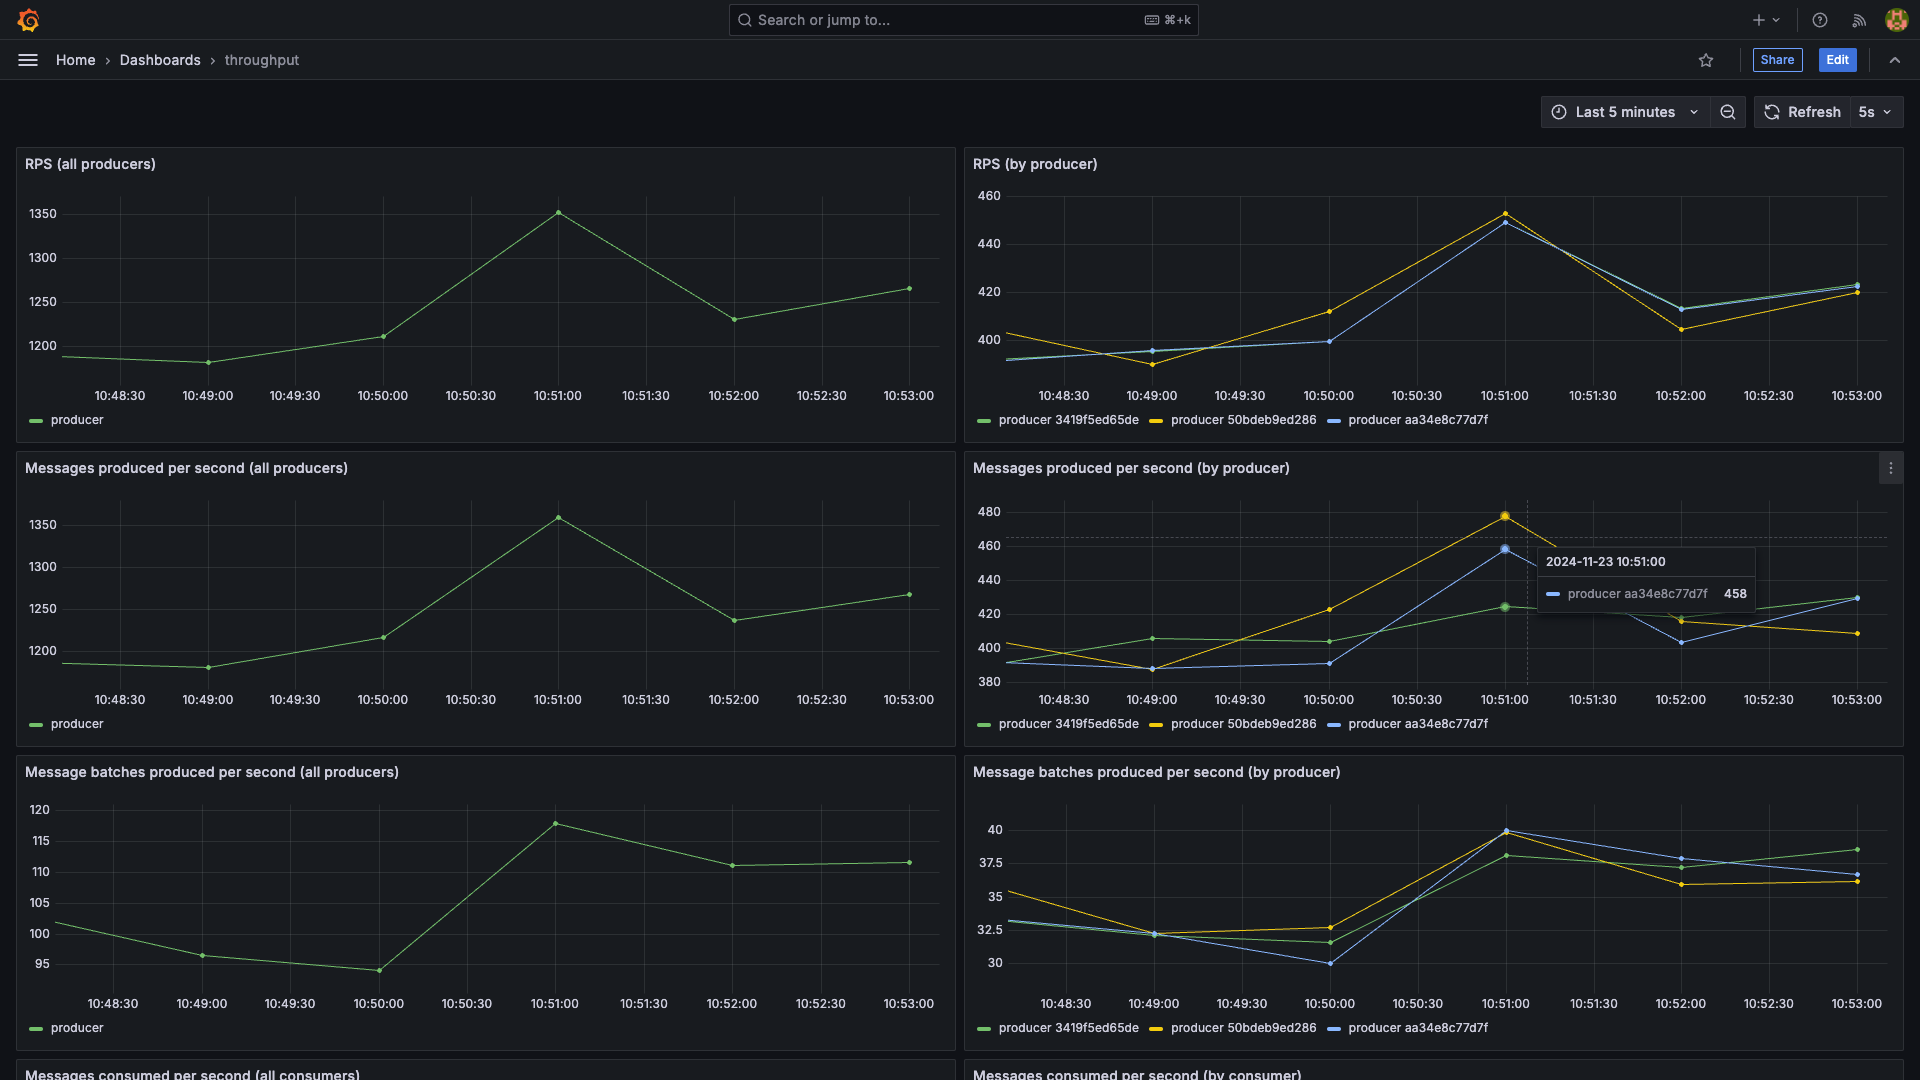
Below you can see a sample dashboard, but note that only the final row is from OutboxKit, the others are from other sources.
Setup
Setting up OutboxKit with OpenTelemetry, follows common patterns you probably already know.
AddOutboxKitInstrumentation extension methods are available for the TracerProviderBuilder and MeterProviderBuilder types, which are part of the OpenTelemetry API.
Here's an example of how you can set up OutboxKit with OpenTelemetry (mixed in with some other instrumentation):
builder.Services
    .AddOpenTelemetry()
    .ConfigureResource(r => r.AddService("MySqlEfPollingSample"))
    .WithTracing(b => b
        .AddAspNetCoreInstrumentation()
        .AddOutboxKitInstrumentation()
        .AddSource(FakeBatchProducer.ActivitySource.Name)
        .AddSource("MySqlConnector")
        .AddOtlpExporter())
    .WithMetrics(b => b
        .AddAspNetCoreInstrumentation()
        .AddMeter("MySqlConnector")
        .AddOutboxKitInstrumentation()
        .AddOtlpExporter());
Note that you should add the YakShaveFx.OutboxKit.Core.OpenTelemetry package to your project to get access to the AddOutboxKitInstrumentation extension methods.

